Case Study: “Not Provided” 2013 Forecast

In October 2011, Google introduced the encryption of search queries from logged in users and every person concerned with SEO started to talk about being “not provided.” Estimations from Google said that less than 10% of data will be affected. But is it really just 10%?
Since we manage over 200 sites, we know that the “not provided” percentage has been increasing every month. This is especially true if you look at Google Tops for main keywords in highly-competitive niches. It’s more than Google had originally estimated and our Marketing Team at Devellar decided to make a prediction for 2013 by focusing on monitored trends since October 18th, 2011.
Purpose
Based on our stats, we can predict monthly changes in keyword data from Google analytics and effectively predict how fast “not provided” from “all traffic” and “first traffic” is progressing.
Methodology
We included four sites from highly-competitive niches whose traffic is stable or increasing. We did not include sites that were affected by any Google update or had experienced traffic changes in the last two years.
We consider the time series Y = [Y1,…,Yn] – % Not Provided from All. We have the stats from over 15 months (October 2011 – Dec 2012) for 4 sites (n=15). For each site, we applied the following: We excluded releases from the series in order to neutralize their impact on the statistical characteristics of the series.
From our research, we concluded that the data for October 2011 was inconclusive. For the final analysis we included the two time periods of November 2011 – December 2012 and January 2012 – December 2012. This approach was used to minimize seasonal inaccuracy.
For the calculations, we used the autoregressive model, Y is the time series we consider, p is the autoregressive order, а0 and ар are model coefficients. Model coefficients are found by the method of least squares (OLS).
To determine the order of auto-regression, we used the partial autocorrelation function (PACF) because it can help determine the lags that must be included in the model.
We created the models for the series of options and chose the best one according to the following criteria: The coefficient of determination, the Akayke criterion, and the Durbin-Watson statistic.
By using these methods, we were able to predict “not provided” traffic on the sites for 12 months. Taking the average of the four sites, we got the average forecast of “not provided” for 2013. The calculation approach showed the tendency based on previous outcomes.
Results
This is what we got:
All Traffic 2013 Forecast |
|||||
|---|---|---|---|---|---|
| Month | Site 1 | Site 2 | Site 3 | Site 4 | Average Forecast |
| Jan-13 | 34.02% | 28.72% | 40.15% | 38.29% | 35.29% |
| Feb-13 | 35.25% | 27.67% | 42.07% | 39.27% | 36.06% |
| Mar-13 | 36.45% | 30.61% | 43.94% | 40.12% | 37.78% |
| Apr-13 | 37.62% | 31.57% | 45.76% | 40.87% | 38.96% |
| May-13 | 38.76% | 32.88% | 47.52% | 41.53% | 40.17% |
| Jun-13 | 39.86% | 33.47% | 49.24% | 42.11% | 41.17% |
| Jul-13 | 40.94% | 33.71% | 50.91% | 42.61% | 42.04% |
| Aug-13 | 41.98% | 33.72% | 52.53% | 43.06% | 42.82% |
| Sep-13 | 43.00% | 33.18% | 54.11% | 43.45% | 43.43% |
| Oct-13 | 43.99% | 34.65% | 55.64% | 43.79% | 44.52% |
| Nov-13 | 44.95% | 35.23% | 57.13% | 44.09% | 45.35% |
| Dec-13 | 45.88% | 35.94% | 58.58% | 44.35% | 46.19% |
First Traffic 2013 Forecast |
|||||
|---|---|---|---|---|---|
| Month | Site 1 | Site 2 | Site 3 | Site 4 | Average Forecast |
| Jan-13 | 37.07% | 30.65% | 44.12% | 38.24% | 37.52% |
| Feb-13 | 38.35% | 31.64% | 45.74% | 39.21% | 38.73% |
| Mar-13 | 39.58% | 32.58% | 47.24% | 40.05% | 39.86% |
| Apr-13 | 40.77% | 33.48% | 48.65% | 40.79% | 40.92% |
| May-13 | 41.92% | 34.32% | 49.97% | 41.43% | 41.91% |
| Jun-13 | 43.02% | 33.47% | 51.19% | 42.00% | 42.83% |
| Jul-13 | 44.09% | 35.88% | 52.34% | 42.49% | 43.70% |
| Aug-13 | 45.12% | 36.61% | 53.41% | 42.93% | 44.51% |
| Sep-13 | 46.11% | 37.29% | 54.40% | 43.30% | 45.28% |
| Oct-13 | 47.06% | 37.94% | 55.33% | 43.64% | 45.99% |
| Nov-13 | 47.99% | 38.55% | 56.20% | 43.92% | 46.67% |
| Dec-13 | 48.88% | 39.14% | 57.02% | 44.18% | 47.30% |

By the end of December 2013 we will lack half of keywords data, with around 46% of all traffic and 47%
of “first traffic” becoming “not provided.”
Conclusion
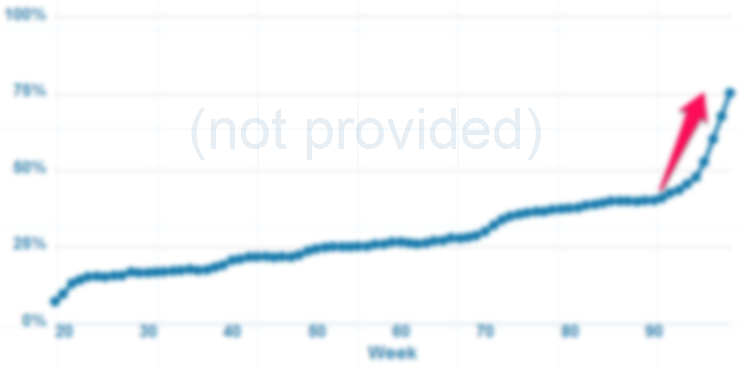
Lately, the marketing world is talking more about “not provided.” I accidentally came across this great chart of “not provided” and it’s pretty cool stuff. It’s updated every day and monitors 60 different websites.
Last year, Optify conducted a study of “not provided” stats. They collected significant data that included more than 400 websites and more than 7 million keywords and Barry Schwartz published part of it on SearchEngineLand.
“Not provided” is definitely set to increase. Let’s remember the most recent events that leave no doubt about the developing trend. Google is hiring a product marketing manager, who will work on making users sign in or the fact that Chrome is transitioning to a secure search now. Chrome is now the most popular browser with about 47% of the usage share.
So let’s see if our predictions come true that we will reach the 47% point of “not provided” by the end of December 2013.
I would also like to say thank you to our statistics and data guru Elena Fabricheva from the R&D Department. Her help allowed me to conduct the research by playing with all those scientific formulas and approaches.

